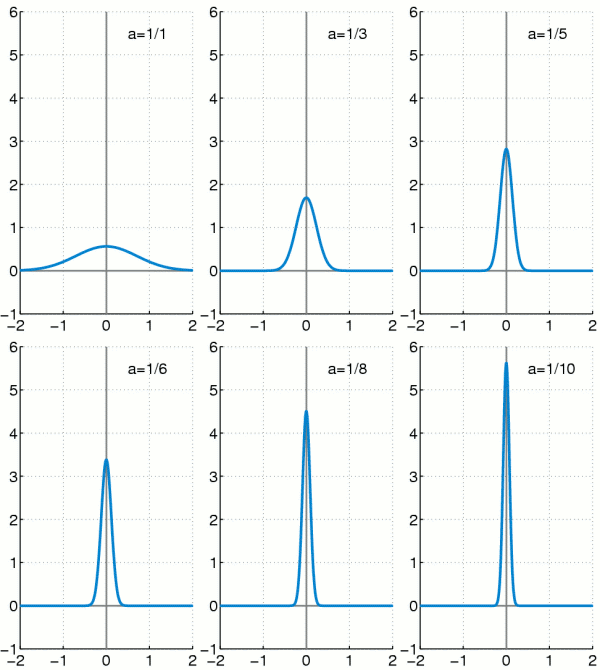
File:Dirac function approximation.gif

From testwiki
Jump to navigation Jump to search

Dirac_function_approximation.gif(200 × 335 pixels, file size: 89 KB, MIME type: image/gif, looped, 10 frames, 2.0 s)

This file is from Wikimedia Commons and may be used by other projects. The description on its file description page there is shown below.

Description Illustration of approximating the Dirac delta function by gaussians.
Date (UTC)
Source self-made with MATLAB
Author Oleg Alexandrov


Public domain I, the copyright holder of this work, release this work into the public domain. This applies worldwide.
In some countries this may not be legally possible; if so:
I grant anyone the right to use this work for any purpose, without any conditions, unless such conditions are required by law.

Source code (MATLAB)

% Illustration of approximating the Dirac delta function with gaussians.

function main()

   r = 3; % the power in the Bernoulli inequality
   
   % KSmrq's colors
   red    = [0.867 0.06 0.14];
   blue   = [0, 129, 205]/256;
   green  = [0, 200,  70]/256;
   yellow = [254, 194,   0]/256;
   white = 0.99*[1, 1, 1];

  % Set up the grid and other parameters
   N = 300;
   A = -2; B = 2; 
   C=-1; D = 6;

   X = linspace(A, B, N);
   
   % Set up the figure
   lw = 3; % linewidth
   fs = 18; % font size

   for p=1:10

      a=1/p;

      % gaussian
      Y=(1/(a*sqrt(pi)))*exp(-X.^2/a^2);

      figure(1); clf; 

      set(gca, 'fontsize', fs);
      set(gca, 'linewidth', 0.4*lw)
      hold on;
      
      plot_axes (A, B, C, D, lw/1.5);
      
      plot(X, Y, 'color', blue, 'linewidth', lw);
      
      axis equal; axis([A, B, C, D]); 
      
      set(gca, 'XTick', [-2, -1, 0, 1, 2]) % text labels on the x axis
      grid on;
      
      H=text(B-1.5, D-0.5, sprintf('a=1/%d', p), 'fontsize', fs);

      % save to disk
      file = sprintf('Frame%d.eps', 1000+p);
      disp(file);
      saveas(gcf, file, 'psc2')
      
      pause(0.1);

   end

 % Converted to gif with the command
 % convert -antialias -density 100 -delay 20 -loop 10000 Frame10* Dirac_function_approximation.gif
 % then scaled in Gimp   
   
function plot_axes (A, B, C, D, lw)
   
   gray = 0.5*[1, 1, 1];
   
   plot([A B], [0, 0], 'linewidth', lw, 'color', gray);
   plot([0, 0], [C, D], 'linewidth', lw, 'color', gray);

Captions

Add a one-line explanation of what this file represents

Items portrayed in this file

depicts

12 January 2008

image/gif

File history

Click on a date/time to view the file as it appeared at that time.

Date/TimeThumbnailDimensionsUserComment
current23:51, 12 January 2008Thumbnail for version as of 23:51, 12 January 2008200 × 335 (89 KB)wikimediacommons>Oleg Alexandrovtweak

The following page uses this file: