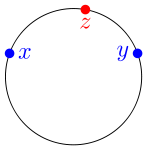
% an illustration of a circle as a convex metric space
function main()


   N=100;

   Theta=linspace(0, 2.1*pi, N);
   X=cos(Theta);
   Y=sin(Theta);

   figure(1); clf; hold on; axis equal; axis off;
   lw=1.5; black=[0, 0, 0];
   plot(X, Y, 'color', black, 'linewidth', lw)

%  plot some balls, to emphasize where the points are
   ball_rad=0.07;
   blue=[0, 0, 1]; red=[1, 0, 0];

   t=0.45; P = floor(N*t); ball(X(P), Y(P), ball_rad, blue)
   t=0.2; Q = floor(N*t); ball(X(Q), Y(Q), ball_rad, red)
   t=0.05; R = floor(N*t); ball(X(R), Y(R), ball_rad, blue)


%  plot text
   fs=50;
   d=0.008;
   ii=sqrt(-1);
   place_text_smartly (X(P)+i*Y(P), fs, 2.7, d, '\it{x}', 6)
   place_text_smartly (X(R)+i*Y(R), fs, 6.2, d, '\it{y}', 6)
   place_text_smartly (X(Q)+i*Y(Q), fs, 1.5, d, '\it{z}', 6)

   % a phony box to avoid matlab bugs in saving to eps
   h0=0.3;
   white=0.99*[1, 1, 1];
   plot(0, 1+h0, 'color', white);
   plot(0, -(1+h0), 'color', white);

   saveas(gcf, 'Circle_as_convex_metric_space.eps', 'psc2');

function ball(x, y, r, color)
   Theta=0:0.1:2*pi;
   X=r*cos(Theta)+x;
   Y=r*sin(Theta)+y;
   H=fill(X, Y, color);
   set(H, 'EdgeColor', 'none');


function place_text_smartly (z, font_size, pos, d, tx, N)
   p=cos(2*pi/N)+sqrt(-1)*sin(2*pi/N);
   z = z + p^pos * d * font_size;
    shiftx=0.00003; shifty=0.003;
	x = real (z); y=imag(z);
	H=text(x+shiftx*font_size, y+shifty*font_size, tx);
	set(H, 'fontsize', font_size, 'HorizontalAlignment', 'c', 'VerticalAlignment', 'c')


