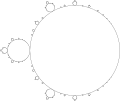
File:Cactus model of Mandelbrot set.svg

Original file (SVG file, nominally 534 × 448 pixels, file size: 55 KB)
This file is from Wikimedia Commons and may be used by other projects. The description on its file description page there is shown below.
Contents
Summary
| DescriptionCactus model of Mandelbrot set.svg |
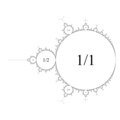
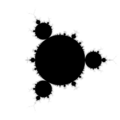
English: Topological model of Mandelbrot set (reflects the structure of the object). Topological model of Mandelbrot set without mini Mandelbrot sets and Misiurewicz points (Cactus model).
Polski: Topologiczny model zbioru Mandelbrota ( okazuje strukturę obiektu) |
|||
| Date | ||||
| Source | Own work | |||
| Author | Adam majewski | |||
| Other versions |
|
|||
| SVG development InfoField | This plot was created with Gnuplot.
|
Compare with
Explanation
It is topological model of Mandelbrot set without :
- mini Mandelbrot sets
- Misiurewicz points
Compare with :
- "The Mandelbrot cactus" ("square" parametrisation) by Robert L. Devaney [1]
- Lavaurs algorithm
- model of basilica Julia set [2]
Algorithm
- draw main circle ( analog to main cardioid of Mandelbrot set)
- draw Ford circles on the main circle using
- Farey sequences as an internal angle
- new radius related with old radius and internal angle (p/q) :
GiveNewRadius(old,_p,_q):=old*abs(sin(%pi*_p/_q)/(_q*_q));[3]
- repaet n-times the same procedure on each circle ( n is a number of steps)
Extension
One can do similar image but using cardioid as main component. [4]
Maxima CAS src code
First version
This version uses gnuplot svg terminal to make image.
Drawing code is dynamically created :
- one instruction : plot2d (plots)
- one list of parameters to display ( plots), which is created during computations
/* maxima cas batch script
checked in
Maxima version: 5.21.1
Maxima build date: 8:13 4/26/2010
Host type: i686-pc-mingw32
Lisp implementation type: GNU Common Lisp (GCL)
Lisp implementation version: GCL 2.6.8
*/


/* -----------------------------------definitions of functions -------------------------------------*/


/*  gives list o Farey fractions ( here internal angles in turns ) */
GiveFareySequence(n):=
block(
[a],
a:[0,1],
if n>=2 then
for denominator:2 thru n step 1 do
for numerator:1 thru (denominator-1) step 1 do
 a:cons(numerator/denominator,a),
  return(setify(a))
);

/* gives farey sequence without 0 and 1 angle */
GiveSequence(n):=
block(
[a],
a:GiveFareySequence(n),
/* remove 0 and 1 angle */
a:disjoin(0,a),
a:disjoin(1,a),
return(a)
);


GiveGlobalAngle(old,new):=mod(old-(1/2-new),1);


GiveNewRadius(old,_p,_q):=old*abs(sin(%pi*_p/_q)/(_q*_q));

/*
distance = old_radius+new_radius ???
angle is global , it is measured in turns = rational number
*/
GiveNewCenter(old_c,distance,angle):=
realpart(old_c)+ distance*cos(2*%pi*angle)  + %i*(imagpart(old_c)+distance*sin(2*%pi*angle));


/* gives a list which is used by plot2d for drawing circle */
plot_circle(c,r):=[parametric, realpart(c)+r*cos(t), imagpart(c)+r*sin(t)];


plot_circles(_c,_r,old_global_angle,max_depth, max_denominator):=
block
(
[depth, /* order of components */
 angles,
 global_angle, /* angle in turns of line thru old and new center */
 plot_list,
 p,r,c],
depth:0,
plot_list:[],
plot_list:cons(plot_circle(_c,_r),plot_list),
/* main circle */
depth:depth+1,
if depth<max_depth
	then
	(
	 angles:GiveSequence(max_denominator),
	 for local_angle in angles do
		(
		/* new internal angle = local angle */
		p:ratnum(local_angle),
		q:ratdenom(local_angle),
		global_angle:GiveGlobalAngle(old_global_angle,local_angle),
		/* new circle */
		r:GiveNewRadius(_r,p,q),
		c:GiveNewCenter(_c,_r+r,global_angle),
		plot_list:append(plot_circles(c,r,global_angle,max_depth-1,max_denominator),plot_list))

	),
return(plot_list)
);


/* ------------------------------------initial values ------------------------------*/

radius:1;
center:0;
denominator:7; /* max denominator of internal angle; then 2*denominator circles are drawn at each level of depth */
MainAngle:1/2;
MaxDepth:4;  /* den = 10 and depth= 4  gives an error */
plots:[]; /* list for plot2d */
file_title:concat("circle_",string(denominator),"_",string(MaxDepth),".svg");


/* ---------------------  computing -----------------------------------------*/

plots:plot_circles(center,radius,MainAngle,MaxDepth, denominator);


/* --------------------------- drawing code ---------------------------------------*/

set_plot_option([plot_format, gnuplot]);
set_plot_option([nticks, 80]);
set_plot_option([t,-%pi,%pi]);
set_plot_option([gnuplot_preamble, "unset key;set title 'Topological model of Mandelbrot set'"])$ /* */
set_plot_option([color,black]);
set_plot_option([gnuplot_term, svg]);
set_plot_option([gnuplot_out_file, file_title]);

plot2d (plots)$ /* plots uses list 'plots' . Dynamically generating the plot commands */
Comments :
- plots list created by this program grows rapidly and makes memory problems
- svg file contains paths not circles. Why ?
Second version
SVG file is directly created thru concatenate of strings.
There are also some changes in svg code :
- removed space between nmber and unit ( CSS sntax , http://www.w3.org/TR/SVG11/types.html#DataTypeLength )
- make group ( thx to Emil Jerabek)
/* maxima cas batch script

checked in

Maxima version: 5.21.1

Maxima build date: 8:13 4/26/2010

Host type: i686-pc-mingw32

Lisp implementation type: GNU Common Lisp (GCL)

Lisp implementation version: GCL 2.6.8


https://commons.wikimedia.org/wiki/File:Circle_7_4.svg

*/


kill(all);
remvalue(all);

/* -----------------------------------definitions of functions -------------------------------------*/


/*  gives list o Farey fractions ( here internal angles in turns ) */

GiveFareySequence(n):=

block(

[a],

a:[0,1],

if n>=2 then

for denominator:2 thru n step 1 do

for numerator:1 thru (denominator-1) step 1 do

 a:cons(numerator/denominator,a),

  return(setify(a))

);


/* gives farey sequence without 0 and 1 angle */

GiveSequence(n):=

block(

[a],

a:GiveFareySequence(n),

/* remove 0 and 1 angle */

a:disjoin(0,a),

a:disjoin(1,a),

return(a)

);


/* -  circle functions --------------*/

GiveGlobalAngle(old,new):=mod(old-(1/2-new),1);


GiveNewRadius(old,_p,_q):=1.2*float(old*abs(sin(%pi*_p/_q)/(_q*_q)));


/*

distance = old_radius+new_radius

angle is global , it is measured in turns = rational number

*/

GiveNewCenter(old_c,distance,angle):=float(

realpart(old_c)+ distance*cos(2*%pi*angle)  + %i*(imagpart(old_c)+distance*sin(2*%pi*angle)));


/* uses global var angles */

plot_circles(dest,_c,_r,old_global_angle,max_depth):=

block

(

[depth, /* order of components */


 global_angle, /* angle in turns of line thru old and new center */

  p,r,c],

depth:0,

c:_c,

r:_r,


/* parent circle */

if (r> minimal_radius)

	then CircleSVG(dest,realpart(_c),imagpart(_c),r),


depth:depth+1,

if depth<max_depth

	then

	 for local_angle in angles do

		(

		/* new internal angle = local angle  gives childrens*/

		p:ratnum(local_angle),

		q:ratdenom(local_angle),

		global_angle:GiveGlobalAngle(old_global_angle,local_angle),

		/* new circle */

		r:GiveNewRadius(_r,p,q),

		c:GiveNewCenter(_c,_r+r,global_angle),

		if (r> minimal_radius)

	then plot_circles(dest,c,r,global_angle,max_depth-1))


);


/* ---------------------------------basic svg functions -----------------------*/


BeginSVG(file_name,cm_width,cm_height,i_width,i_height,_strokeWidth):=

block(

	destination : openw (file_name),

	printf(destination, "<?xml version=\"1.0\" encoding=\"UTF-8\" standalone=\"no\"?>~%"),

	printf(destination, "<!DOCTYPE svg PUBLIC \"-//W3C//DTD SVG 1.1//EN\"~%\"http://www.w3.org/Graphics/SVG/1.1/DTD/svg11.dtd\">~%"),


	printf(destination,"<svg width=\"~dcm\" height=\"~dcm\" viewBox=\"0 0 ~d ~d\" xmlns=\"http://www.w3.org/2000/svg\" version=\"1.1\">~%", /* no space between number and unit */

	cm_width,cm_height,i_width,i_height),
	printf(destination,"<g fill=\"white\" stroke=\"black\" stroke-width=\"~f\">",_strokeWidth), /* all shapes in group have the same width and color */

	return(destination)

);


CircleSVG(dest,center_x,center_y,_radius):=

printf(dest,"<circle cx=\"~f\" cy=\"~f\" r=\"~f\" />~%",

	center_x,center_y,_radius);


EndSVG(destination):=

(
printf(destination,"</g>~%"), /* close the group */

printf(destination,"</svg>~%"),

close (destination)

);


compile(all);


/* ------------------------------------initial values ------------------------------*/


stroke_width:0.5; /* width of circle boundary */

minimal_radius:stroke_width; /* radius of minimal circle to draw */

iWidth:1600;

iHeight:1200;

radius:iHeight/4;

center:(iWidth - iWidth/4)  + %i*iHeight/2; /* in pixels */

max_denominator:15; /* max denominator of internal angle; then 2*denominator circles are drawn at each level of depth */

MainAngle:1/2;

MaxDepth:6;  /* depth greater then 5 is to big cause radii are small */

numberOfCircles:1+max_denominator^MaxDepth;


/* --------------- svg file --------------------------  */

path:"~/maxima/batch/mandel/shrub/"$ /* pwd  ; if you put here working directory name then graphic file will be saved in that dir */

file_title:concat(path, "c_",string(max_denominator),"_",string(MaxDepth),"_",string(minimal_radius),".svg");


/* ---------------------  computing and making svg file -----------------------------------------*/

angles:GiveSequence(max_denominator); /* global var */

f:BeginSVG(file_title,60,40,iWidth,iHeight,stroke_width);

plot_circles(f, center,radius, MainAngle, MaxDepth);

_time:time(%);

EndSVG(f);


/* ------------------------info -------------------------------------------------------------- ----- */

disp(concat("file  ",file_title, " made of ",string(numberOfCircles)," circles in ",string(_time[1]),"  sec"));
C src code
SVG development
Source code
C src code
/*

gcc d.c -Wall -lm


angle is measured :
* in turns
* counterclockwise

https://en.wikipedia.org/wiki/Turn_(geometry)

angle can be :
* global ( 0 = 1 is on horizontal = x axis )
* local, where 0 is internal angle of parent

compare with :
[[:File:Circle 7 4.svg|Circle 7 4.svg]]


mutually and externally tangent circles
http://mathworld.wolfram.com/TangentCircles.html
Two circles are mutually and externally tangent if distance between their centers is equal to the sum of their radii

check
https://validator.w3.org/check

*/

#include <stdio.h>
#include <stdlib.h>
#include <string.h> //strncat
#include <math.h> // sin, M_PI


/* -  ------ global variables ---------- */


// RGB colors
 // http://www.december.com/html/spec/color4.html
char *black    = "#000"; /* hexadecimal number as a string for svg color*/
char *white    = "#FFF";
char *burgundy = "#9E0508";
char *SeaGreen = "#068481";
char *turquoise= "#40E0D0";
char *red      = "#F00";
char *navy     = "#000080";
char *blue     = "#00F";


 // svg file
 FILE * fp;
 char *filename; //="shrub.svg";
 // svg parameters
 char *comment = "";
 double stroke_width = 0.5;
 double minimal_radius; /* radius of minimal circle to draw */

 char *stroke_color ;
 char *fill_color ;

 double  Xmax = 1000.0;
 double  Ymax = 1000.0;


 // main circle = period 1
  double  r1; // radius
 // center = x1 + y1*I;
 double X1;
 double Y1;


 const int iLevelMax = 4; //
 const int dMax = 14;  // maximal denominator of internal angle
 const double main_angle = 0.5; // in turns

// ----------------- functions -------------------------------

double  min(double a, double b) {
  return a < b ? a : b;
}


void beginSVG(void){


  char name [30]; /* name of file */
  snprintf(name,20,"%d_%d",dMax, iLevelMax ); /*  */
  filename =strncat(name,".svg", 24);


 fp = fopen( filename,"w");
 if( fp == NULL ) {printf (" file open error \n"); return ; }
 stroke_color = black; // stroke
 fill_color = white; // fill
 minimal_radius = stroke_width; /* radius of minimal circle to draw */

 // period 1 circle
 // center
 X1 = Xmax - Xmax/3.0;
 Y1 = Ymax/2.0;
 r1 = min(X1, Y1)- 2.0*min(X1, Y1)/3.0; // radius


 fprintf(fp,
     "<?xml version=\"1.0\" encoding=\"UTF-8\" standalone=\"no\"?>\n"
     "%s \n "
     "<svg width=\"20cm\" height=\"20cm\" viewBox=\"0 0 %.0f %.0f\"\n"
     " xmlns=\"http://www.w3.org/2000/svg\" version=\"1.1\">\n",
     comment,Xmax,Ymax);

  fprintf(fp,"<g stroke=\"%s\" stroke-width=\"%f\" fill=\"%s\">\n",   stroke_color, stroke_width, fill_color); // group open

printf(" beginSVG done \n");

}


void EndSVG(void){
 fprintf(fp,"</g>\n"); // group close
 fprintf(fp,"</svg>\n"); // svg close
 fclose(fp); // file close
 printf("endSVG done\n file %s saved \n",filename );
}


// draw circle to svg file
void draw_circle(double x, double y,  double radius ){


       fprintf(fp,"<circle cx=\"%.1f\" cy=\"%.1f\" r=\"%.1f\" />\n", x, y, radius);
      // else printf ("radius < minimal_radius\n");
}


/*
https://stackoverflow.com/questions/19738919/gcd-function-for-c
The GCD function uses Euclid's Algorithm.
It computes A mod B, then swaps A and B with an XOR swap.
*/

int gcd(int a, int b)
{
    int temp;
    while (b != 0)
    {
        temp = a % b;

        a = b;
        b = temp;
    }
    return a;
}


// GiveNewRadius(old,_p,_q):=old*abs(sin(%pi*_p/_q)/(_q*_q))

double GiveNewRadius(double OldRadius, int num, int den ){

  //double t = (double)num / den;
  double d2 = den*den;
  //printf( "t = %f ;  d2 = %f ",t, d2);
  //double temp =(num*num)/d2;
  //printf( "temp = %f ; ",temp);
  return 1.3*OldRadius/d2; //
}


//GiveGlobalAngle(old,new):=mod(old-(1/2-new),1);
double GiveNewAngle (double old, double n, double d) {
  double t =old-(main_angle-n/d);
  if (t > 1.0) t-=1.0;
  return t;
}


/*
    test_v =Test(x1,y1, r1, x,y, Radius);
    printf(" n/d = %d / %d \n", num, den );
    printf( "main circle center = (%f ; %f) radius = %f \n", x1,y1, r1);
    printf( "new  circle center = (%f ; %f) radius = %f \n", x,y, Radius);
    printf( "test = %f \n", test_v);
    */
long double Test(double x1, double y1, double r1, double x2, double y2, double r2){

return (sqrt((x1-x2)*(x1-x2)+ (y1-y2)*(y1-y2)) - (r1+r2));

}


// shrub is a part of the limb after Myrberg-Feigenbaum point ( end of period doubling cascade )
void DrawShrub(double n, double d){

}

/*

. The part of the Mandelbrot set connected to the main cardioid at this bifurcation point is called the p/q-limb.
*/


// t = global angle in turns
void drawSVG(double t,  int iLevel, double x, double y, double r)
{
 // internal angle = n/d
 int n;  // numerator
 int d;  // denominator


 double r_new; // Radius;
 double x_new,y_new; // center
 double distance; // new_radius + old_radius
 double t_local;
 int iLevel_new;


  draw_circle(x,y,r);


   for (d = 2; d <= dMax; ++ d ){

     for (n = 1; n < d; ++ n ){
       if (gcd(n,d)==1 )// irreducible fraction
            {

           if ( iLevel > iLevelMax) {
               DrawShrub(n,d);
               break;}
           iLevel_new = iLevel +1;

           // num/den * 1/2  where 1/2 is a local angle
           // period doubling cascade
           // new radius
           r_new = GiveNewRadius(r, n, d );
           if (r_new > minimal_radius) {
           //
           distance =  r + r_new  ;
           //printf("n = %d; d = %d iRadius = %d \n", num, den, iRadius);
           // new center
           t_local = GiveNewAngle(t, n, d);
           x_new = x + distance* cos(2.0*M_PI*t_local);
           y_new = y + distance* sin(2.0*M_PI*t_local);
           //
           drawSVG(t_local, iLevel_new, x_new, y_new, r_new);
           }


           } //  if(gcd
     } // for (n
   } // for(d


}


// ------------------------------------- main ---------------------------------------------------
int main(){


 beginSVG();

 drawSVG(main_angle, 0, X1, Y1, r1);


 EndSVG();


 return 0;
}
References
- ↑ The Mandelbrot cactus by Robert L. Devaney
- ↑ Combinatorial Julia Sets (1) By Jim Belk
- ↑ Mu Atom Sizes by Robert Munafo
- ↑ From Farey sequence to M-set: archive copy at the Wayback Machine
Licensing
- You are free:
- to share – to copy, distribute and transmit the work
- to remix – to adapt the work
- Under the following conditions:
- attribution – You must give appropriate credit, provide a link to the license, and indicate if changes were made. You may do so in any reasonable manner, but not in any way that suggests the licensor endorses you or your use.
- share alike – If you remix, transform, or build upon the material, you must distribute your contributions under the same or compatible license as the original.

|
Permission is granted to copy, distribute and/or modify this document under the terms of the GNU Free Documentation License, Version 1.2 or any later version published by the Free Software Foundation; with no Invariant Sections, no Front-Cover Texts, and no Back-Cover Texts. A copy of the license is included in the section entitled GNU Free Documentation License.http://www.gnu.org/copyleft/fdl.htmlGFDLGNU Free Documentation Licensetruetrue |
Captions
Items portrayed in this file
depicts
some value
20 June 2010
image/svg+xml
93368ab03162d5aad29dcb18eee26a5684c7cbe8
56,275 byte
448 pixel
534 pixel
File history
Click on a date/time to view the file as it appeared at that time.
| Date/Time | Thumbnail | Dimensions | User | Comment | |
|---|---|---|---|---|---|
| current | 12:42, 28 July 2018 |  | 534 × 448 (55 KB) | wikimediacommons>Trlkly | "Cropped" out empty space, and further optimized (with Inkscape) without losing any precision. |
File usage
The following page uses this file:


